
Know where the process
actually stalls.
How long does it take from publication to acceptance? Which channel brings prospective tenants who actually turn up to the viewing? Where are cases piling up? Reporting and benchmarks answer these questions based on your own cases – not on gut feeling.
- Key figures per portfolio, location and property
- Comparison values from the Immomio customer base
- Export for supervisory board and reporting
Four questions reporting answers
Vacancy days
How long does a flat stand empty between move-out and the start of the new tenancy?
per property, portfolio and location
Channel performance
Which channel brings applicants who actually sign?
from the listing to acceptance
Team workload
Where are cases piling up – and with whom?
cases per employee and week
Benchmark
How do you compare with similar portfolios?
comparison with similar portfolios
Your benefits in detail.
All key figures are generated from cases your team handles anyway – with no data entry effort and no second data store.
Where the time goes
Lead times per process step: publication, first contact, pre-selection, viewing, acceptance, contract. You see the bottleneck, not just the result.
Which channel really delivers
Applications, viewing attendance, acceptance rate and drop-outs per channel – website, portals, Immomio property portal, applicant pool. Reach and impact assessed separately.
Comparison instead of gut feeling
Benchmarks put your figures in the context of similar portfolios and segments. That turns a key figure into a decision – for example on channel budget or team structure.
For operations, for management, for the board.
The same data, three levels of detail: the team manages the day, management steers the portfolio, and the board receives a report without rebuilding it in Excel.
- Operational dashboard: open cases, deadlines, backlogs
- Portfolio report: vacancy days, tenant turnover, time to let
- Channel report: costs and impact per marketing channel
- Board export as PDF and CSV
- Time series across months, quarters and years
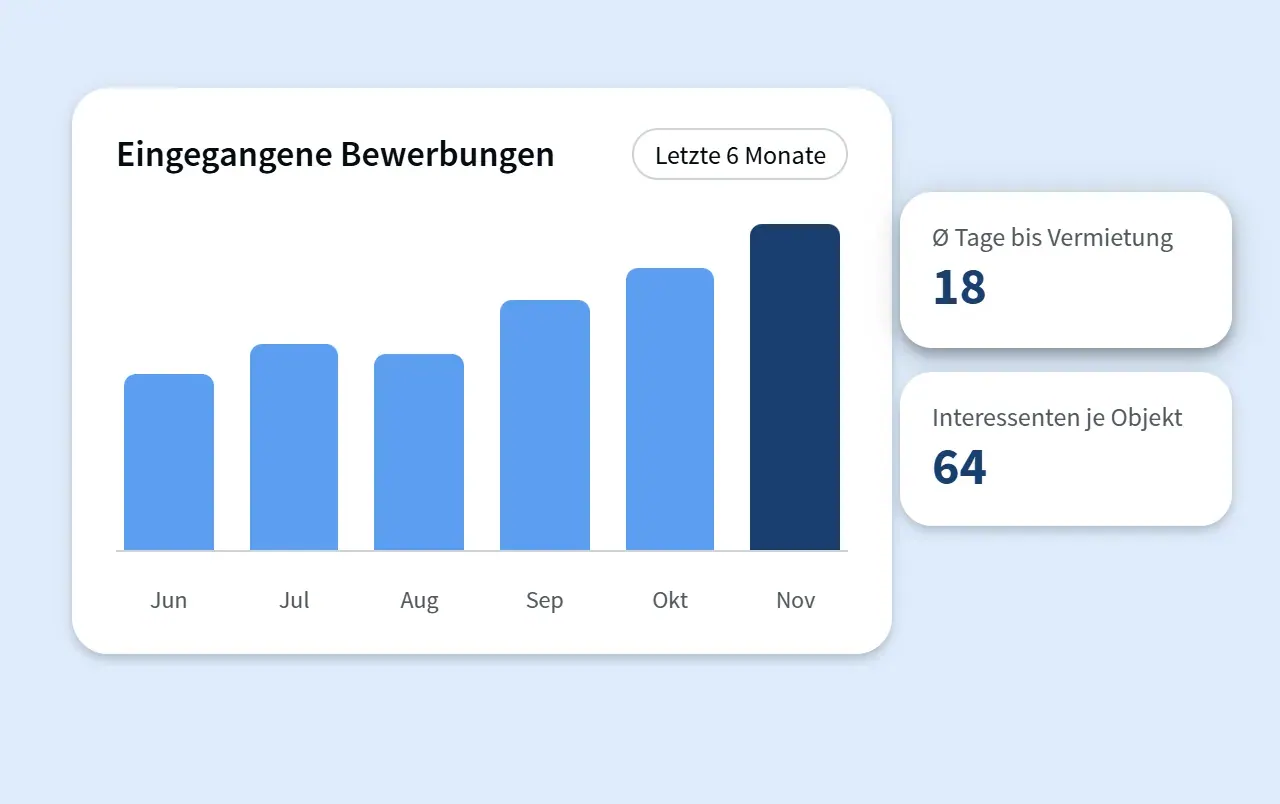
Channel performance
Example: share of applications that lead to a viewing
Sample values. What matters is not the number of applications but what comes of them.
Key figures nobody has to maintain.
The analysis sits where the process runs. That removes the usual gap between what the system says and what the report says.
- Automatic collection from ongoing cases
- No manual follow-up entries, no parallel spreadsheet
- Role and permission concept per location and team
- Personal data only where it is required
- Export to ERP, BI tool or report template
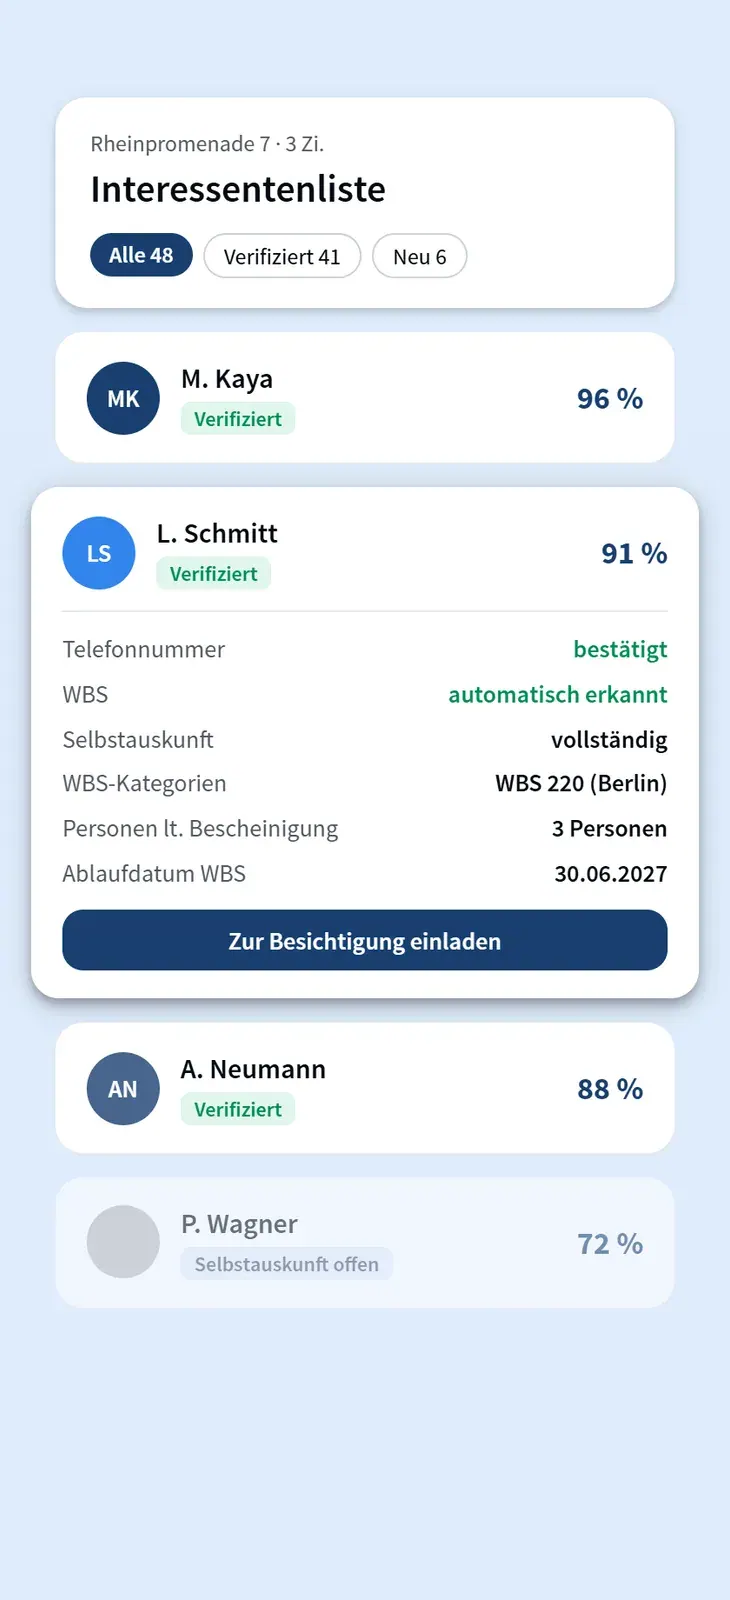
It fits together because it was built together.
Every product works on the same data foundation – no double entry, no additional interface.

Reporting & benchmarks – quick answers.
Where do the comparison values for benchmarks come from?+
From aggregated, anonymised values across the Immomio customer base, grouped by segment and portfolio size. No data from individual customers is disclosed.
Do we have to record key figures manually?+
No. All values are generated from the cases your team handles in Immomio. Manual upkeep would make the figures useless.
Can we transfer the data to our own BI system?+
Yes. In addition to PDF and CSV exports, the open API is available for regularly transferring key figures into your reporting.

Put your vacancy days on the table.
Together we look at the key figures your process already generates today – and at the ones you cannot see yet.